On gold’s five-minute chart, price may cross a moving average, sweep a previous high or low, and form a price gap within a short period. Which event provides directional context, and which helps define an entry?
This framework assigns each tool a role: use EMA 61/168 to filter direction, and ICT-style context and structure to locate an area and an entry sequence. Define invalidation and a target before placing an order.
This is a hybrid framework for study and testing, not a standard ICT rule or a trading signal. This article contains no backtest or live-trading results establishing an edge or showing that this EMA pair outperforms other settings.
The framework at a glance
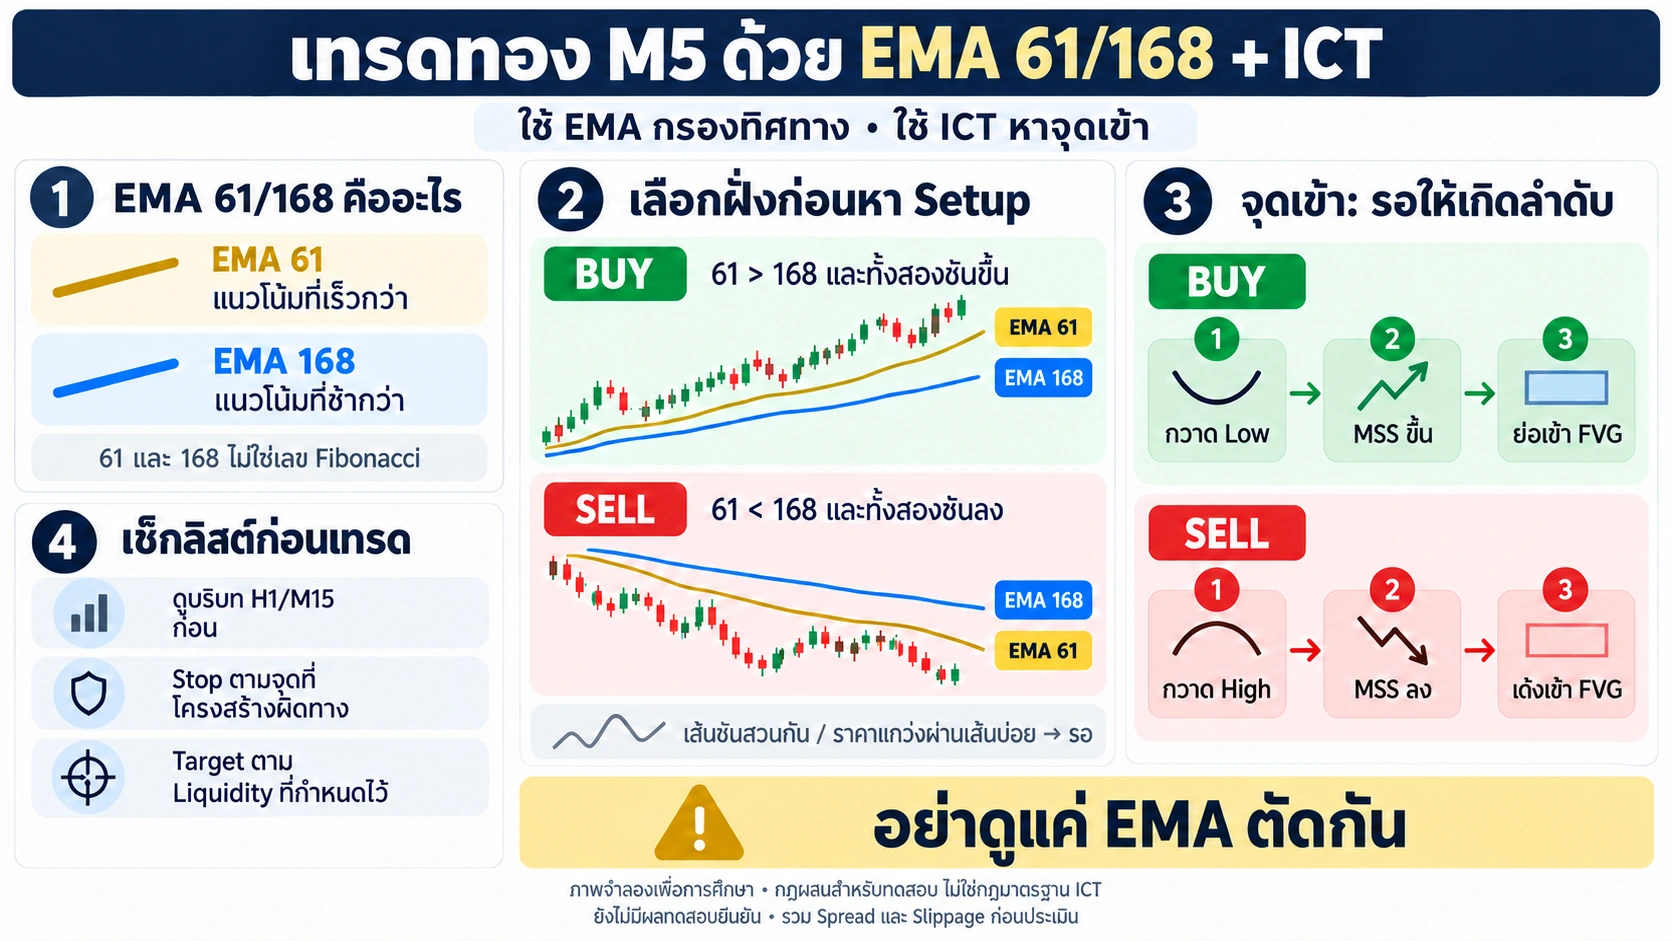
What do EMA 61 and 168 represent on M5?
An exponential moving average gives recent prices more weight than older prices. It helps track direction but still lags price and is not designed to identify exact tops or bottoms. Fidelity: EMA
Set both lines to the M5 closing price with no offset. EMA 61 is the faster line in this pair; EMA 168 responds more slowly.
| Line | Period expressed in bar time | Proposed role |
|---|---|---|
| EMA 61 | 61 × 5 = 305 minutes, or 5 hours 5 minutes | Faster directional context |
| EMA 168 | 168 × 5 = 840 minutes, or 14 hours | Slower directional context |
These are conversions of bar counts, not complete EMA lookback boundaries or elapsed clock time across market closures. Older observations retain diminishing weight. An M5 EMA does not directly replace an H1 EMA or H1 market structure.
Neither 61 nor 168 is a Fibonacci number. Their ratio, 168 ÷ 61 ≈ 2.754, is neither 1.618 nor 2.618. Assess this pair through testing rather than an assumed connection with Fibonacci.
Use higher timeframes for location and M5 for timing
Start with H1/M15 structure, important highs and lows, an area of interest, and a potential price objective before consulting the EMA filter.
In ICT analysis, previous highs and lows can act as reference points for presumed liquidity. This is an interpretation of price, not direct observation of every resting order. The model studied in ICT 2022 Mentorship Episode 6 connects liquidity context with market structure shifts and fair value gaps.
For premium and discount, select the high–low range in advance and use its midpoint as equilibrium. Trading below an EMA does not necessarily mean trading in that range’s discount. See the range examples in ICT 2022 Mentorship Episode 4.
For this continuation model, wait when H1/M15 context conflicts with the M5 filter. Treat reversal trades as a separate model with separate rules and results.
A starting rule: choose a direction before seeking a setup
The following are proposed test rules, not rules taken directly from ICT lessons. Evaluate completed candles only.
| M5 condition | Action in this model |
|---|---|
| EMA 61 > EMA 168 and both rise | Look for a buy setup |
| EMA 61 < EMA 168 and both fall | Look for a sell setup |
| Slopes disagree or conditions are incomplete | Wait |
For a reproducible starting definition, rising means the EMA at the latest closed candle exceeds its own value six candles earlier. Reverse the comparison for falling. Six M5 candles represent 30 minutes of bar time; this setting has not been validated as optimal.
The infographic also suggests waiting when price repeatedly crosses the lines. Turn this into a measurable rule before testing. One experimental version could suspend entries when the close changes sides relative to EMA 61 at least four times over the last 12 candles, until that condition clears. Neither this count nor the window has been validated.
Sweep, displacement, MSS and FVG
- Sweep: price trades beyond a preselected high or low and returns inside. A breach alone can instead be a breakout that continues.
- Displacement: a strong, clear move, assessed alongside the structure it breaks. A backtest requires an explicit candle-size or strength criterion fixed in advance.
- MSS — market structure shift: a break of a relevant swing in the new direction. This framework waits for a closing break and requires the swing to be marked before the break occurs.
- FVG — fair value gap: a three-candle formation. A bullish FVG has candle three’s low above candle one’s high; a bearish FVG has candle three’s high below candle one’s low. Consider displacement and context alongside the formation.
A three-candle gap alone is not a complete setup. Price is not guaranteed to return to fill it.
Buy example: continuation after a pullback
- Define context: H1/M15 supports an upward direction, with a preselected area such as an M15 bullish FVG and an objective above price.
- Pass the filter: EMA 61 is above EMA 168 and both rise under the chosen definition.
- Wait for location: price pulls back into the selected area. Touching the area alone does not trigger entry.
- Wait for the M5 sequence: price sweeps a short-term low and returns inside, then displaces upward, closes above the preselected swing high, and forms a bullish FVG.
- Define entry: choose a consistent rule, such as a retracement to the FVG midpoint after confirmation. If price never returns, record a missed opportunity rather than chase it.
- Define stop and target: place the stop below the point that invalidates the idea, accounting for spread and execution. Target the high or liquidity reference selected in advance. Skip the trade if the available distance fails the system’s reward-to-risk requirement.
Price does not have to touch EMA 61 or 168. Requiring the FVG to be near an EMA is an additional filter: define “near” and test it separately.
Sell example: continuation after a rally
- H1/M15 supports a downward direction, with an area such as an M15 bearish FVG and an objective below price.
- EMA 61 is below EMA 168 and both fall.
- Price rallies into the selected area, sweeps a short-term high and returns inside.
- Downward displacement closes below the preselected swing low and leaves a bearish FVG.
- Wait for a rally into the FVG midpoint under the same entry rule.
- Place the stop above invalidation and target a preselected low or liquidity reference, checking reward-to-risk before entry.
Do not look only at an EMA crossover. Check context, location, the entry sequence and risk.
Limitations to record
A break below EMA 61 can be a pullback or the beginning of a reversal. Crossing EMA 168 does not establish a reversal either. Waiting for an EMA crossover can also delay entry until after a substantial move.
This is a continuation framework and may reject early reversal opportunities. Count those missed opportunities alongside the losing trades the filter avoids.
For XAUUSD, use the data feed and account type intended for execution. Check server time, spread, commission, slippage and contract specifications before sizing positions. Separate results by trading session and news periods. Define any news exclusions before testing, rather than removing observations after seeing outcomes.
How to test whether the filter helps
Compare two versions on the same historical period: A uses the defined ICT setup; B adds EMA 61/168. Keep entries, stops, targets and position management unchanged.
First freeze definitions for swings, displacement, FVG age, order cancellation and setup expiry. Use only information available at the decision time, including completed H1/M15 candles, to avoid look-ahead bias.
Record trade count, win rate, average net return in R, maximum drawdown and losing streaks. 1R is the initial risk per trade. Include trading costs and both winning and losing trades rejected by the filter. If a stop and target are reached within the same M5 candle, use finer data or a conservative sequencing rule.
Then validate on a separate period not used to tune the rules and forward-test before committing real money. This article provides no test results that can substitute for those steps.
The framework should make three questions answerable before entry: why this direction, what event must occur, and where is the idea invalidated? Whether EMA 61/168 improves the system remains a question for evidence.
Sources and scope
- Fidelity — Exponential Moving Average: weighting and limitations of EMA.
- TradingView — Exponential Moving Average: inputs, calculation and lag.
- The Inner Circle Trader — 2022 Mentorship Episode 6: original teaching on liquidity context, market structure shifts and FVGs.
- The Inner Circle Trader — 2022 Mentorship Episode 4: examples involving ranges, equilibrium and setups.
These sources explain the tools and concepts; they do not endorse the EMA 61/168 pair, six-candle slope rule or other experimental rules in this article. The AI-generated infographic illustrates the framework and is not real market data. This is educational content, not personalized investment advice.